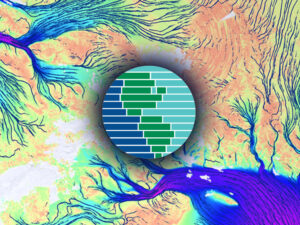
Mapping what is wet
Bourgeau-Chavez and her team set out to collect data in the same ways to measure the same criteria. They relied on imagery from two satellites that could identify differences between land and water, as well as different types of vegetation. Surface temperature data from the Landsat satellite helped them distinguish wetlands from uplands, or higher ground. However, Landsat data cannot accurately see wetlands that exist beneath a canopy of shrubs or forest cover. To penetrate vegetation, the researchers added imagery from the Phased Array type L-Band Synthetic Aperture Radar (PALSAR) instrument on the Japan Aerospace Exploration Agency and Ministry of Economy, Trade and Industry Advanced Land Observing Satellite (ALOS).
Because vegetation can change throughout the growing season, the team collected Landsat and ALOS PALSAR imagery spanning spring, summer, and fall from 2007 through 2011. Images from the two data sets were aligned and mosaicked together to form complete coverage around the lakes. This image fusion allowed the researchers to distinguish wetlands from other types of land cover, and even clarify different types of wetlands, peatlands, and aquatic beds. Distinguishing various wetland types would make the maps more accurate and permit more specific applications, such as identifying aquatic bird habitat or pinpointing invasive plant species.
To verify the satellite images, the researchers conducted fieldwork at 1,191 random sites along the Great Lakes coasts. During the summers of 2010 and 2011, teams donned muck boots and waders before sloshing into the wetlands, carrying precise latitude-longitude locations and laminated aerial photos. Geographer Michael Battaglia helped develop the maps, and conducted fieldwork. “We had to navigate to a predetermined point, and once we got there, we would mark where exactly we were within the aerial photo,” Battaglia said. At each site, the teams noted vegetation types as well as growth stage, height, density, and water levels. When necessary, researchers boarded small boats to reach some of the sites. They also took geolocated photographs for further verification.
A subsequent field campaign from 2012 to 2014 brought the total number of sites to 1,751. That total included visits to the Canadian side of the lakes, part of what made this mapping effort successful. At a conference, Bourgeau-Chavez happened to meet a professor from McMaster University in Ontario who not only offered to share her wetland data, but also had a student who could collect field data using the exact same methods. Bourgeau-Chavez said, “We took the student through all the steps of how to create the maps, and field work, and we sent him off with the algorithm and data sets.”